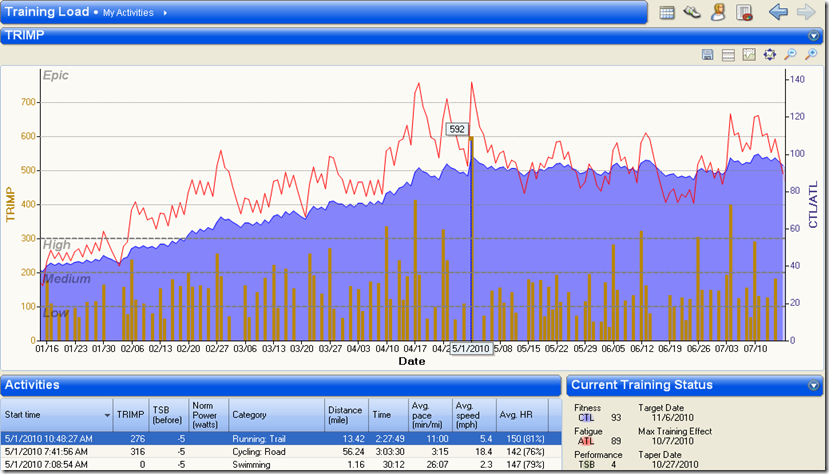
Somewhere between the first and second month of using Sport Tracks I discovered the “Training Load plugin”. The immediate response was, “Oh my god, you can track all of that?” At first glance, the graph is just a big mess with all kinds of bars, lines, shaded areas, and acronyms that don’t mean much. Once you look under the hood a bit, you see that the graph is very simple and can be quite useful in determining you current fitness level, how rested you are, and tapering for a race.
To dig in, you’ll need to know a couple of simple definitions:
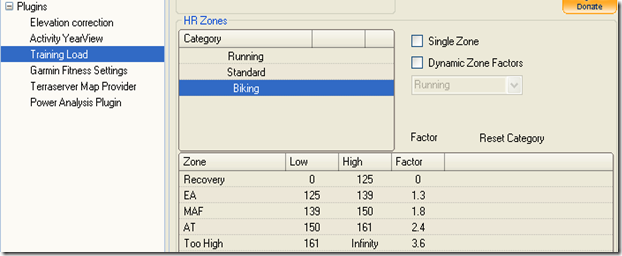
TRIMP – Training Impulse: This is an arbitrary score given to each training event. This is based on your HR and duration for each given activity. You can set up your HR training zones in Sport Tracks or leave them at their default. Each HR zone is given a factor as you can see below. So for example, my Bike for the day was 3:03:30, or ~ 183 min, with an Avg HR of 142. The factors are incremental, so you wouldn’t have 1.8 for the entire HR range of 139 – 150. The result is a factor of about 1.73. So, 183 minutes multiplied by 1.73 gets you a TRIMP score of 316. Same holds true for running. With Swimming you’ll get a 0, unless you’re using a HR monitor that works under water(nothing is perfect). You don’t need to make any of these calculations as this is all done for you with the plugin. I just added it because I’m sure someone would ask.
CTL – Chronic Training Load: In Blue, is a measure of your Fitness based on your activities over the longer term like 45 days.
ATL – Acute Training Load: In Red, is a good measure of your current level of fatigue. This is more of a measure of your current training load over the past 10 days or so.
TSB – Training Stress Balance: This is basically the difference between your most recent activities vs. over the longer term. You can see below prior to 5/1, I went into negative TSB fairly consistently. This was during the month leading up to a 70.3 race, so I had some longer rides, longer runs, etc. A negative TSB means you’ve been doing more recently compared to what you were doing. Positive TSB on the other hand indicates less work recently.
For those of you who want to know all the details about how this is calculated go Here.
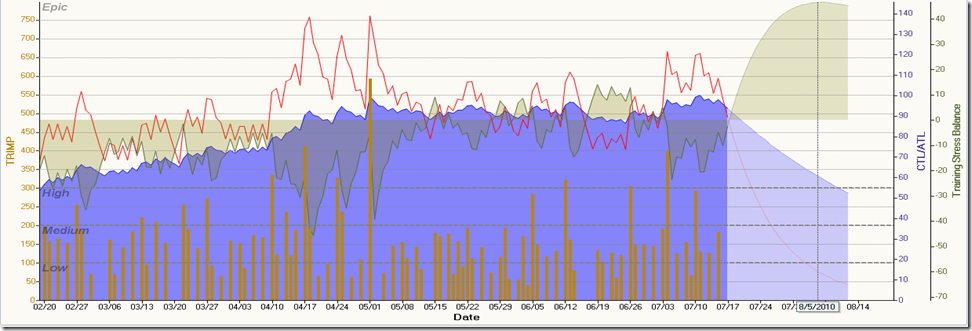
Now, if you slide the graph over to the left a bit, you can project into the future. I’m writing this on 7/17, so if I just kept my training relatively light, I would be set for a maximal effort ~ Aug5th. However, if you do absolutely nothing, you can see how your fitness level is projected to plummet as well.
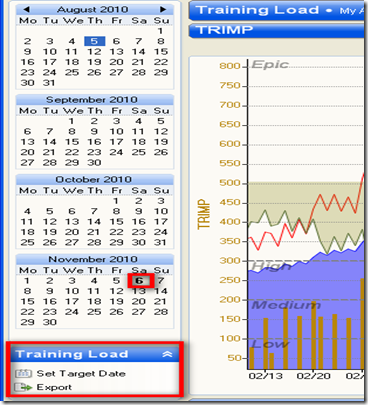
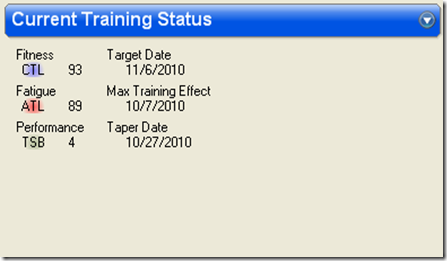
To choose a race date in the future, just click on the date on the calendar column on the left hand side . Then under Training Load, Choose “Set Taget Date”. Over on the far right-hand side you will see your Current Training Status. So my race is 11/6 and I suspect my last really long workout will be around 10/7. Full Tapering will be about 10 days out. Pretty cool, eh?
Oh and I totally forgot the best part. Sport Tracks is FREE!! The Plugins are FREE!! Some of the plugins have a button where you can donate some money to the developer who created the plugin. Some of the plugins are definitely worth a donation for the creativity. To check out a full list, go to the Plugins Catalog page.
So, what Training Log software does everyone else use? What is the best thing you like about it?

Pingback: Training Logs for Triathletes | Jeff Greene